Rims, central veins and atrophy
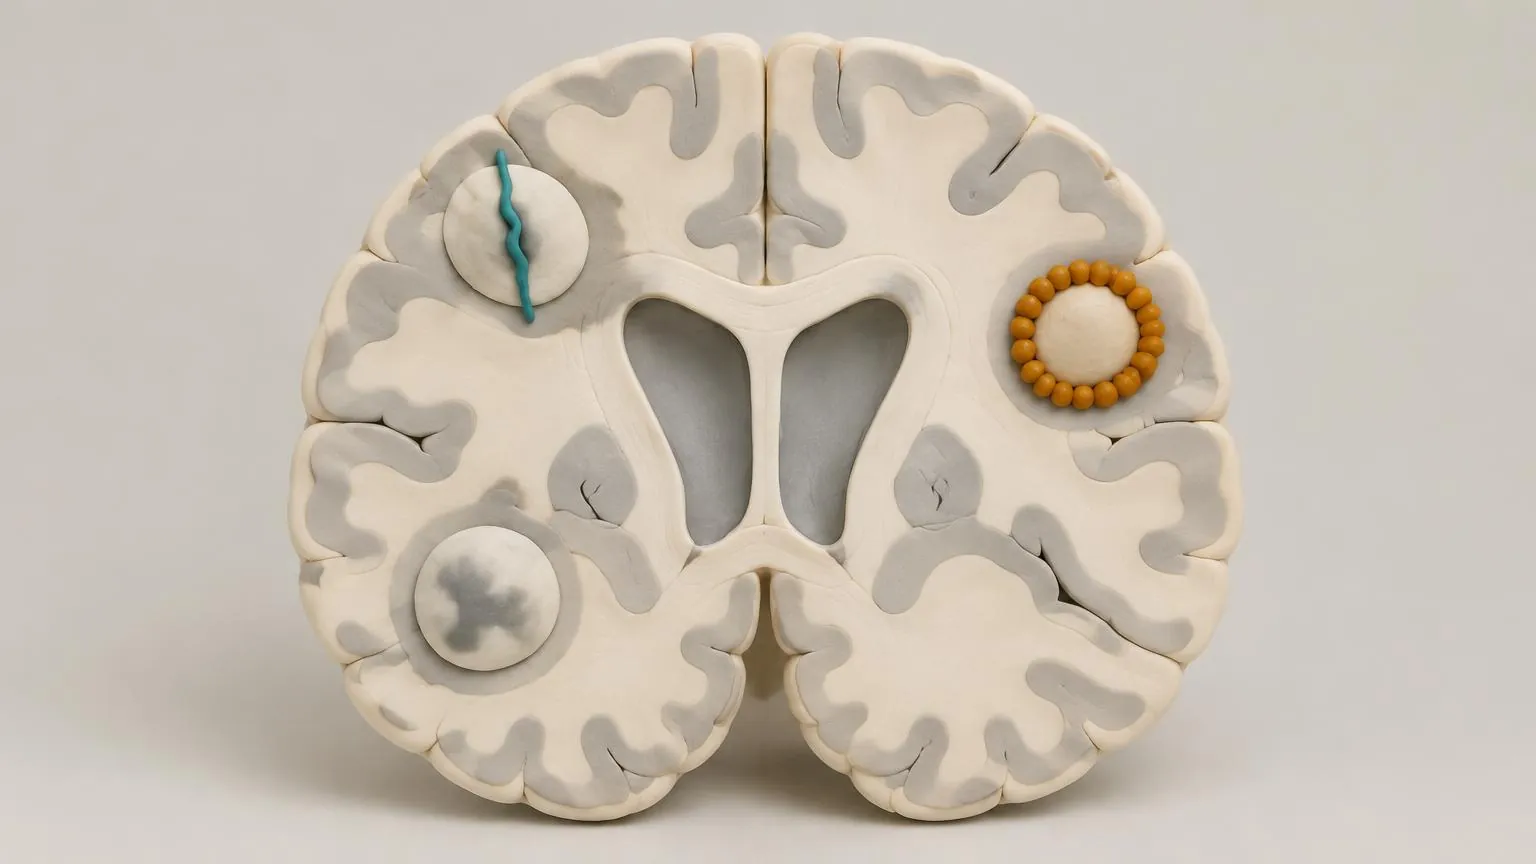
The clinico-radiological paradox
The number and size of lesions on standard MRI match a person's disability poorly. Two people with similar scans can be affected very differently, and lesions can come and go without symptoms. This mismatch has a name, the clinico-radiological paradox. It has several explanations: lesions in some places matter more than in others, cortical lesions and diffuse damage are hard to see, standard scans cannot tell repaired lesions from destroyed ones, and the brain compensates for damage to different degrees. The methods in this lesson try to close that gap.
The central vein sign
Most MS lesions form around a small vein, and on sequences sensitive to veins, such as susceptibility-weighted imaging, the vein can be seen as a thin dark line or dot in the middle of the lesion. White spots from small vessel disease or migraine usually lack it. A North American consensus in 2016 proposed a standard definition and argued that the sign can separate MS from its mimics. The 2024 McDonald criteria now accept the central vein sign, where available, as supporting evidence that adds specificity in defined situations.
Rims of iron
Lesions whose edges are still inflamed carry iron-laden microglia at their rim, which shows as a dark ring on the same sequences (lesson 3.2). In a study at the US National Institutes of Health, 56 per cent of people with MS had at least one rim lesion, and those with four or more reached disability at a younger age. Rim lesions are rare in the diseases that mimic MS, so the 2024 criteria accept them too as supporting evidence. They are also being tested as a measure of whether treatments reach smouldering inflammation.
Atrophy: measuring what has been lost
Everyone's brain shrinks slowly with age. In MS it shrinks faster. In a study that followed people for an average of seven and a half years with the same software, brain volume fell by 0.51 per cent a year in MS against 0.27 per cent in healthy people. A loss of more than 0.37 per cent a year best separated the two groups, but even this cut-off picked out only two thirds of the people with MS. Loss of grey matter, especially in the deep grey matter and the cortex, matches disability better than loss of white matter. The spinal cord shrinks too, and cord atrophy is closely linked to walking problems.
Atrophy is hard to use for one person. Measurements vary between scanners and with hydration, and changes of a few tenths of a per cent are close to the noise. In the first months after starting an effective treatment, brain volume can drop faster as swelling from inflammation resolves, an effect known as pseudo-atrophy. For now atrophy is mainly a trial measure, used especially in progressive MS.
Yearly loss
Start
After 5 years
Total volume lost: 1.3 %
0.27 % · healthy average in the study
Other methods on the way
Several methods are mostly used in research. Magnetisation transfer and diffusion imaging are sensitive to myelin and to the structure of white matter, and are used in trials of repair. Scanners at 7 tesla show cortical lesions and rims far better than routine machines. PET scans with tracers that bind activated microglia show smouldering inflammation directly. Each could become part of routine care if it proves reliable on ordinary scanners.
Check yourself
What we know
- Lesion counts on standard MRI explain disability poorly, for reasons that are now partly understood.
- The central vein sign and paramagnetic rims help separate MS from its mimics and are part of the 2024 criteria.
- The brain loses volume faster in MS, and grey matter loss matches disability best.
What we don't know
- How to measure atrophy reliably enough to guide care for one person.
- The best rule for how many lesions must show a central vein, and how well the sign works across scanners.
- Whether reducing rim lesions or atrophy with treatment will mean less disability over decades.
In the research now
Loading current research…
Key terms
- Small vessel disease
- Damage to the brain's small blood vessels with age, high blood pressure or diabetes. It causes white spots on MRI that can be mistaken for MS.
- Clinico-radiological paradox
- The poor match between lesions on standard MRI and a person's disability.
- Pseudo-atrophy
- A faster fall in brain volume soon after starting an effective treatment, as swelling from inflammation resolves.
- Cortical lesion
- A lesion in the cortex, the outer grey matter of the brain. Often hard to see on standard MRI.
- Susceptibility-weighted imaging
- An MRI technique sensitive to iron and veins, used to see rim lesions and the central vein sign.
- Myelin
- The fatty sheath wrapped around many nerve fibres in the brain and spinal cord. It lets signals jump quickly along the fibre. MS damages it.
- Microglia
- The resident immune cells of the brain and spinal cord. In MS they sustain slow inflammation at the edges of chronic lesions.
- Lesion (plaque)
- An area of damage where myelin has been lost and the tissue scarred.
- Central vein sign
- A small vein running through the centre of a lesion on MRI. It can support an MS diagnosis in specified circumstances under the 2024 McDonald criteria.
- McDonald criteria
- The international criteria for diagnosing MS, last revised in 2024 and published in 2025.
References
- Barkhof F. The clinico-radiological paradox in multiple sclerosis revisited. Curr Opin Neurol 2002.https://doi.org/10.1097/00019052-200206000-00003
- Sati P, et al. The central vein sign and its clinical evaluation for the diagnosis of multiple sclerosis: a consensus statement from the North American Imaging in Multiple Sclerosis Cooperative. Nat Rev Neurol 2016.https://doi.org/10.1038/nrneurol.2016.166
- Montalban X, et al. Diagnosis of multiple sclerosis: 2024 revisions of the McDonald criteria. Lancet Neurol 2025.https://doi.org/10.1016/S1474-4422(25)00270-4
- Absinta M, et al. Association of chronic active multiple sclerosis lesions with disability in vivo. JAMA Neurol 2019.https://doi.org/10.1001/jamaneurol.2019.2399
- De Stefano N, et al. Establishing pathological cut-offs of brain atrophy rates in multiple sclerosis. J Neurol Neurosurg Psychiatry 2016.https://doi.org/10.1136/jnnp-2014-309903
Next module · Biomarkers and measures
How MS is measured
Relapses, MRI, disability scores and blood markers: what each one shows and what it misses.
Continue